

Lab Results Review 2026: Why Health Trends Matter Most
A single out-of-range lab result often causes immediate panic, but clinical reality is far more nuanced. Relying on an isolated snapshot from a single blood draw can lead to unnecessary anxiety, misinterpretation of false positives, and rushed medical assumptions. Your body operates in a constant state of flux, adjusting to daily stressors and environmental changes. Therefore, understanding these subtle shifts is essential for managing your own peace of mind.
In our review of standard clinical diagnostic protocols across major testing facilities, the necessity of a Lab Results Review: Why Trends Matter More Than One Number becomes immediately apparent to anyone looking closely at the data. By the end of this guide, you will understand how to evaluate long-term biological data so you can approach your next clinical consultation with clarity. We will explore the mechanics of reference ranges, the science of biological variation, and the necessity of tracking health data continuously.
This article is for educational purposes only and does not replace consultation with a qualified medical professional.
Key Takeaways
A comprehensive Lab Results Review: Why Trends Matter More Than One Number relies on longitudinal tracking because standard reference ranges only represent population averages, not individual baselines.
- Fluctuations are normal: Daily biological variations mean a single test rarely confirms pathology.
- The ToT Framework: Trend-over-Threshold (ToT) tracking prevents false alarms by analyzing the rate of change across multiple tests.
- Context is required: Always discuss isolated high or low markers with a qualified clinician.
The Illusion of the Single-Number Lab Result
Standard medical reference ranges are statistically derived from the middle 95% of a healthy population, meaning 5% of perfectly healthy individuals will naturally test outside these limits. Furthermore, external factors like hydration, fasting state, and time of day heavily influence an isolated lab draw (NIH, 2017). This makes relying on a single data point clinically unreliable.
Why Reference Ranges Are Just Averages
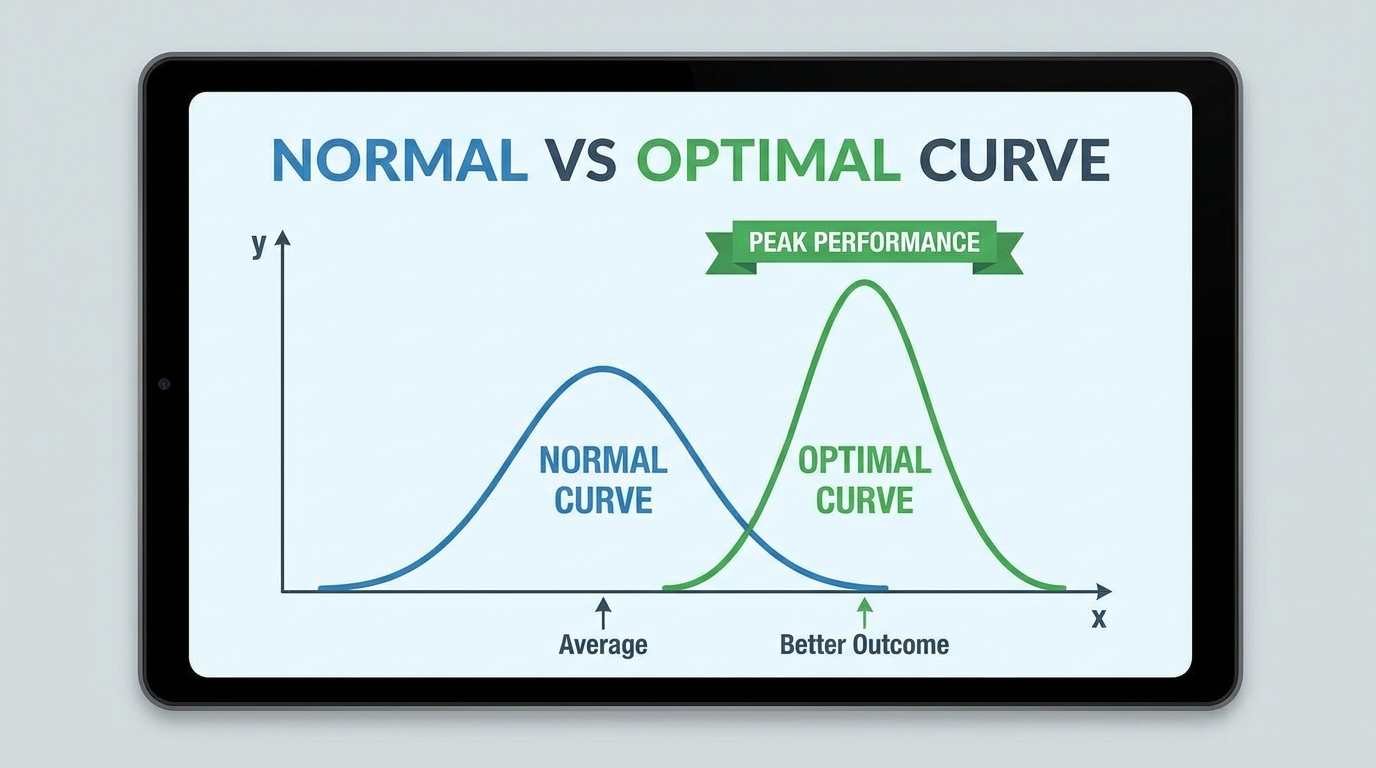
To understand your health data, you must recognize that “normal” ranges represent a statistical bell curve, not a strict binary dividing the healthy from the sick. These limits simply indicate the absence of acute disease within a broad Comprehensive Metabolic Panel (CMP), a standard blood chemistry test. However, falling inside this broad spectrum does not automatically indicate optimal functional wellness.
For instance, when evaluating a bnp lab level—a marker used to measure heart stress—the absolute cutoff number is less informative than your personal baseline over time. Context matters immensely when evaluating cardiovascular strain. A slight elevation in one person might be their functional normal, while in another, it signals emerging stress. This individual biological footprint means comparing your personal results against generalized data points often yields an incomplete clinical picture.
According to the Cleveland Clinic, “It is common for one or two markers on a CMP to fall slightly outside the normal reference range” (2024). Understanding these statistical averages reveals why doctors expect minor fluctuations. Just as your resting heart rate varies whether you are asleep or jogging, your internal blood chemistry constantly recalibrates to meet your body’s immediate physiological demands, leading us directly to the science of biological variation.
`
`
Why Your Lab Numbers Fluctuate
Biological variation refers to the natural, expected daily shifts in your body’s chemistry. Pre-analytical variables—such as whether you drank enough water, your current stress levels, or even the time of day—heavily dictate the numbers on your report. For example, if you take the exact same blood chemistry panel two days in a row, you will receive slightly different results.
Think of this natural volatility like a vehicle’s dashboard. A momentary fluctuation in temperature while driving up a steep hill is an expected functional response, not an inherent systemic failure. Even metrics measuring blood acidity, often searched by patients wondering about a ph lab test full form (potential of hydrogen), fluctuate constantly as your body maintains homeostasis.
Diagnostic facilities account for these realities. Based on CDC CLIA protocols, “Laboratory tests are categorized by complexity, which dictates strict quality control protocols required to ensure accuracy” (2023). Because these isolated fluctuations are entirely expected, modern clinical diagnostics rely heavily on tracking these specific changes over an extended period to eliminate diagnostic guesswork and establish reliable, long-term treatment pathways.
How Trending Reveals Your True Health Trajectory
Tracking laboratory values over time provides a definitive health trajectory that isolated tests cannot offer. This longitudinal approach—central to the Trend-over-Threshold (ToT) Framework—identifies the rate at which biological markers change, allowing specialists to detect emerging issues long before a value officially crosses into an “abnormal” disease state.
The Trend-over-Threshold (ToT) Framework
The Trend-over-Threshold (ToT) Framework shifts the clinical focus from single-day cutoffs to the specific slope of a biological marker over time. Instead of asking if a number is simply “high” or “low,” this method asks how rapidly that number is moving away from your established historical baseline.
To determine if a shift is meaningful, medical professionals use the Reference Change Value (RCV). The RCV is the mathematical threshold required to prove a change represents a true clinical development rather than standard daily noise. For example, if a specific hormone marker jumps by 15%, but the natural biological RCV for that test is 20%, the shift is considered harmless biological noise.
However, if that same marker jumps by 30%, it represents a definitive clinical trend requiring immediate investigation. This mathematical filtering functions exactly like a financial moving average, smoothing out chaotic daily noise to reveal the true underlying momentum of your biological systems. According to the National Institutes of Health, “Applying the reference change value (RCV) to serial laboratory results allows clinicians to mathematically distinguish between normal daily biological fluctuations and true pathological trends” (2017). Applying this framework is especially critical when dealing with highly volatile health metrics, as it actively filters out daily environmental static that frequently causes unnecessary patient anxiety.
Identifying True Clinical Red Flags
Distinguishing between an acute, temporary spike and a chronic, slow-moving shift requires consistent testing conditions. To accurately identify true clinical red flags, you must ensure your testing variables remain identical—maintaining the same fasting state, hydration levels, and time of day for every blood draw. Some markers demand immediate attention regardless of long-term patterns.
For instance, receiving inr test results high enough to indicate severe blood clotting issues triggers urgent clinical action. Conversely, slow-moving metabolic markers require extensive long-term trending to prove a pathological shift. By understanding which metrics demand immediate intervention and which require patient observation, you protect yourself from unnecessary medical anxiety while remaining vigilant. Chronic conditions typically broadcast their arrival through a slow, steady progression of escalating numbers, whereas acute emergencies present as sudden, undeniable spikes.
| Marker Type | Single Test Volatility | Trending Importance |
|---|---|---|
| Clotting (INR) | Low biological noise | Acute spikes require immediate action |
| Hormones (TSH) | High daily fluctuation | Long-term slope indicates clinical shifts |
| Metabolic (Glucose) | Moderate pre-meal variance | Sustained increases reveal emerging conditions |
This trend-based analysis becomes incredibly important when evaluating complex, interconnected biological systems that rely on nuanced physiological feedback loops.
Applying Trends to Thyroid & Tumor Markers
Interconnected biological systems, such as thyroid function and tumor markers, are virtually impossible to diagnose accurately from a single snapshot. Evaluating a solitary metric without its corresponding feedback loop often generates profound patient anxiety and misleading clinical assumptions.
When examining thyroid panels, doctors evaluate the continuous feedback loop between TSH, Free T3, and Free T4. Because hormones operate on dynamic cycles, the pituitary gland constantly adjusts its TSH output based on the precise volume of Free T4 circulating in the bloodstream. Slight variations in these trends within normal ranges can indicate early subclinical thyroid issues long before overt symptoms manifest, such as persistent fatigue, brain fog, or sudden metabolic shifts. According to NIDDK research, “The normal range for a TSH blood test is generally between 0.4 and 4.0, though slight variations in trends can indicate subclinical issues.”
Similarly, tumor markers like CA-125 frequently fluctuate over time and can elevate due to entirely noncancerous inflammatory conditions. Rather than panicking over a single high reading, specialists track the trajectory. The National Cancer Institute emphasizes that “Doctors look for a consistent increase or decrease in levels across multiple tests rather than relying on a single measurement.” Understanding this prevents premature conclusions when a benign cyst or mild endometriosis temporarily elevates the metric.
Understanding these complex panels requires patience and a commitment to gathering serial data over multiple months. This methodical approach eliminates the noise of temporary inflammations and highlights your genuine biological baseline. For a deeper understanding of these specific diagnostic panels, read our comprehensive guides explaining [PENDING INTERNAL LINK: thyroid-hormone-panels | Anchor: “how to read T4 test results” | Status: Awaiting cluster publication] and detailing exactly [PENDING INTERNAL LINK: cancer-tumor-marker-ca125 | Anchor: “how to interpret CA-125 results” | Status: Awaiting cluster publication].
Clinical Diagnostics & Educational Labs
While metabolic and hormonal panels rely heavily on longitudinal trending, certain diagnostic screenings operate on strict, immutable cutoff levels. In the fields of toxicology and microbiology, results are frequently qualitative—indicating a simple presence or absence—rather than quantitative measurements requiring long-term analysis.
In toxicology, pre-employment screening requires understanding specific detection windows for breath, blood, and urine assays. These tests enforce strict initial and confirmatory cutoffs to ensure legal and clinical accuracy, meaning there is no “trending” an illicit substance; it is simply present or absent above a legal threshold. According to SAMHSA protocols, “SAMHSA sets strict initial and confirmatory cutoff concentrations for workplace urine drug testing.”
Conversely, microbiology utilizes biochemical tests to identify specific bacterial strains. Assays like Catalase, Citrate, and Indole use definitive visual indicators to confirm pathogen identities. For example, NCBI Medical Microbiology guidelines state, “A positive catalase test is indicated by rapid oxygen bubble formation upon the addition of hydrogen peroxide.” This specific chemical reaction occurs rapidly because the catalase enzyme breaks down the peroxide into water and oxygen gas. Observing these distinct bubbles provides an immediate, qualitative confirmation that distinguishes staphylococci from streptococci in a clinical setting.
These binary tests represent a distinctly different approach compared to the trending framework used for chronic disease management, highlighting the diverse nature of clinical diagnostic methodologies. For detailed breakdowns of these exact methodologies, explore our guides on [PENDING INTERNAL LINK: urinalysis-toxicology-screening | Anchor: “oraltox 6 panel results meaning” | Status: Awaiting cluster publication], visual references for [PENDING INTERNAL LINK: microbiology-biochemical-tests | Anchor: “catalase test results” | Status: Awaiting cluster publication], and comprehensive [PENDING INTERNAL LINK: educational-nursing-lab-values | Anchor: “lab values for nurses” | Status: Awaiting cluster publication] designed for medical trainees.
How to Access and Track Your Lab Data
To utilize the Trend-over-Threshold (ToT) framework effectively, patients must proactively download, organize, and store their historical laboratory data. You cannot establish an accurate medical baseline without securing continuous access to your past medical records.
Today, major commercial diagnostic centers utilize highly secure digital patient portals. These platforms allow users to view their historical data side-by-side, making it significantly easier to spot long-term shifts in volatile markers like complete blood counts or comprehensive metabolic panels. Organizing this information prior to a consultation ensures a highly productive conversation with your doctor. Having this data readily available eliminates guesswork and empowers you to advocate for your own health trajectory, transforming you from a passive recipient into an active participant in your chronic care management. Tracking these metrics digitally also ensures your specialist has immediate context.
To locate specific testing facilities and learn how to navigate these systems, review our directory covering [PENDING INTERNAL LINK: diagnostic-lab-portals-pricing | Anchor: “DLO lab results online” | Status: Awaiting cluster publication] and other major clinical portals.
Important Limitations and Safety Precautions
Common Pitfalls Reading Your Labs
A major pitfall is assuming a “normal” lab value guarantees absolute health, which causes patients to miss slow-moving subclinical trends. Conversely, overreacting to minor biological fluctuations creates unnecessary anxiety. You must remember that you lack the extensive training required to safely interpret complex medical interactions. Do not attempt to adjust medical treatments or reverse disease based on self-interpreted lab trends without professional assessment. Patient safety always requires objective, expert clinical oversight.
When to Seek Immediate Expert Help
Any acute, severe spike—such as highly elevated liver enzymes, severe drops in hemoglobin, or erratic INR levels—overrides the trending methodology entirely. These critical values represent immediate physiological danger and require immediate consultation with a qualified clinician.
Frequently Asked Questions
How accurate are lab reference ranges?
Lab reference ranges are highly accurate statistical averages representing the middle 95% of a healthy population. They are calculated by testing thousands of asymptomatic individuals and establishing standard cutoffs. However, 5% of perfectly healthy people will naturally test outside this exact range (NIH). An out-of-range number serves as a prompt for further investigation, not an automatic disease diagnosis. Results may vary slightly based on testing equipment and specific calibration methodologies.
What does it mean to trend lab results?
Trending lab results means tracking the rate of change across multiple tests over months or years rather than looking at a single day’s snapshot. This longitudinal approach separates normal biological daily fluctuations from true pathological shifts in your body. For instance, a slow, steady 10% increase in fasting glucose over three years is clinically more significant than one day slightly above the cutoff. Always discuss sustained, multi-test trends with a qualified clinician.
Conclusion
For patients evaluating diagnostics, a lab results review tracking longitudinal trends delivers a far more accurate clinical picture than panicking over a single abnormal test. Standard reference ranges only capture 95% of the population, leaving room for natural biological variation (NIH, 2023). The safest approach combines historical data tracking, understanding testing volatility, and professional clinical evaluation.
The Trend-over-Threshold (ToT) Framework reinforces this exact methodology by proving that evaluating the slope of biological markers prevents false alarms. By focusing on true clinical trajectories rather than isolated noise, you directly address the health anxiety that a single test often provokes.
Begin taking control of your health data today by gathering your past three to five years of laboratory records. Organize these documents chronologically, highlight any gradual shifts in your baseline, and discuss these visual trends at your next scheduled specialist consultation.